89.9%
Land Rover
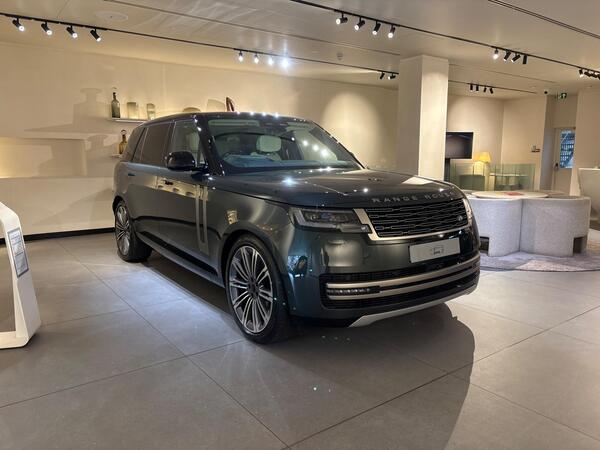
Range Rover3.0 D350 MHEV Autobiography Auto 4WD Euro 6 (s/s) 5dr (LWB)
48d listedUpdated 1 months ago
£137,800
£1,370,800
Market Data
Historical median prices and market-wide percentile ranges
Browse Land Rover listings →Median Price
£26,685
1-month change
-£868
-3.1%
3-month change
-£868
-3.1%
12-month change
+£840
+3.3%
Active Listings
40,116
+1.1%
+428 listings
Est. Sales This Month
15,237
Avg Listing Age
88d
Monthly Turnover
38.4%
15,237 est. sales
Price Spread (P10→P90)
£67,727
-3.6%
-£2,495
| Date | Mean | Median | Total listings | Est. sales | Market value |
|---|---|---|---|---|---|
| May 2026 | £33,936 | £26,685 | 40,116 | 0 | £1.47bn |
| Apr 2026 | £34,234 | £27,553 | 39,688 | 15,237 | £1.47bn |
| Mar 2026 | £34,344 | £28,449 | 40,262 | 17,075 | £1.52bn |
| Feb 2026 | £34,516 | £27,553 | 35,323 | 14,338 | £1.32bn |
| Jan 2026 | £34,028 | £27,553 | 35,283 | 15,097 | £1.32bn |
| Dec 2025 | £34,567 | £27,553 | 32,021 | 11,665 | £1.19bn |
| Nov 2025 | £32,839 | £27,553 | 34,351 | 14,159 | £1.27bn |
| Oct 2025 | £31,791 | £26,685 | 35,293 | 15,354 | £1.30bn |
| Sept 2025 | £31,906 | £26,685 | 34,226 | 15,256 | £1.26bn |
| Aug 2025 | £31,229 | £25,845 | 33,862 | 15,138 | £1.21bn |
| Jul 2025 | £31,083 | £25,845 | 35,986 | 16,149 | £1.29bn |
| Jun 2025 | £30,830 | £25,845 | 36,276 | 15,935 | £1.27bn |
Land Rover
£137,800
£1,370,800
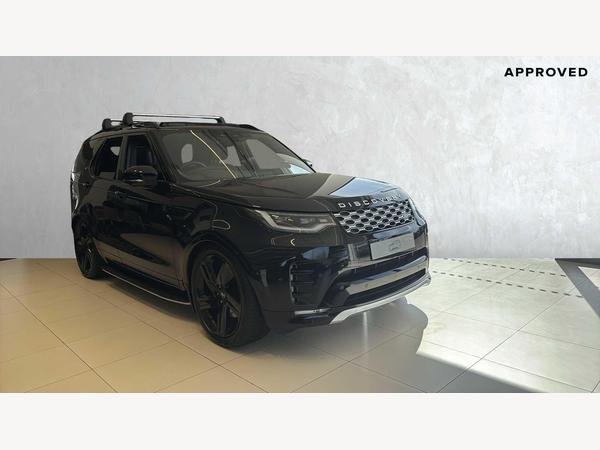
Land Rover
£80,810
£84,178
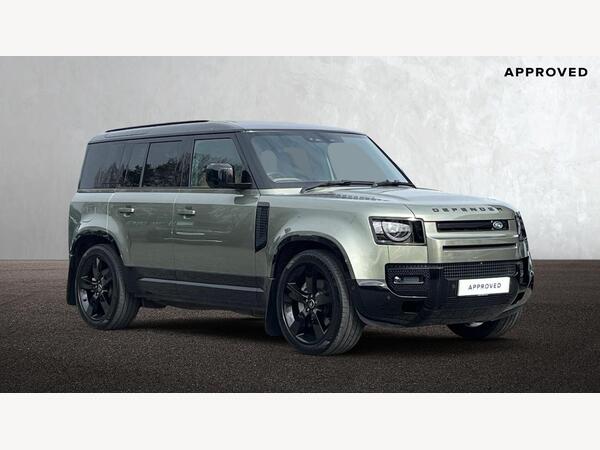
Land Rover
2025
£69,984
£70,984
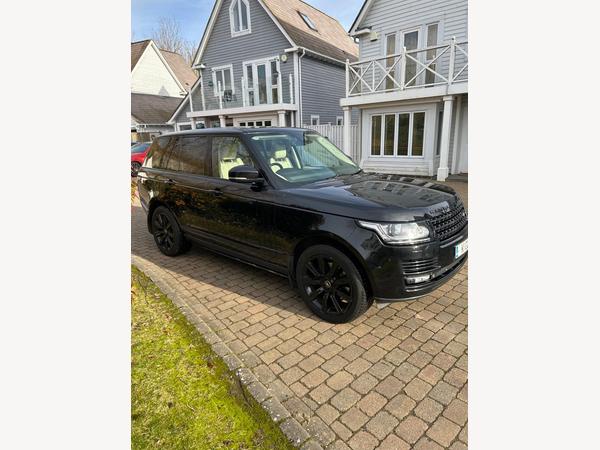
Land Rover
2015
£4,000,000
£15,450
Land Rover
2022
£999,999
£21,600
Land Rover
2021
£429,990
£44,999