89.9%
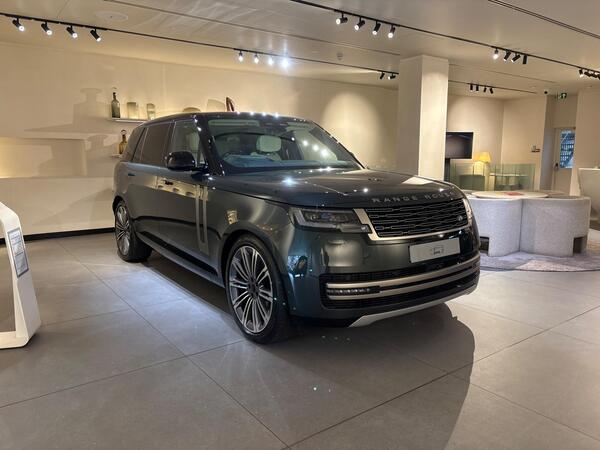
Land Rover
Range Rover3.0 D350 MHEV Autobiography Auto 4WD Euro 6 (s/s) 5dr (LWB)
48d listedUpdated 1 months ago
£137,800
£1,370,800
Market Data
Historical median prices and market-wide percentile ranges
Browse Land Rover Range Rover listings →Median Price
£41,768
1-month change
+£0
0.0%
3-month change
+£1,315
+3.3%
12-month change
+£5,018
+13.7%
Active Listings
4,159
+1.4%
+56 listings
Est. Sales This Month
1,303
Avg Listing Age
76d
Monthly Turnover
31.8%
1,303 est. sales
Price Spread (P10→P90)
£98,103
-4.0%
-£4,120
| Date | Mean | Median | Total listings | Est. sales | Market value |
|---|---|---|---|---|---|
| May 2026 | £58,709 | £41,768 | 4,159 | 0 | £242.8m |
| Apr 2026 | £59,599 | £41,768 | 4,103 | 1,303 | £242.6m |
| Mar 2026 | £60,067 | £41,768 | 4,021 | 1,488 | £240.5m |
| Feb 2026 | £59,022 | £40,452 | 3,569 | 1,302 | £210.0m |
| Jan 2026 | £59,343 | £40,452 | 3,525 | 1,367 | £208.3m |
| Dec 2025 | £58,454 | £40,452 | 3,289 | 1,108 | £191.8m |
| Nov 2025 | £58,404 | £40,452 | 3,426 | 1,243 | £199.3m |
| Oct 2025 | £57,523 | £39,178 | 3,545 | 1,395 | £203.1m |
| Sept 2025 | £58,161 | £39,178 | 3,498 | 1,391 | £203.1m |
| Aug 2025 | £55,487 | £36,749 | 3,414 | 1,354 | £188.8m |
| Jul 2025 | £56,568 | £37,944 | 3,649 | 1,427 | £205.7m |
| Jun 2025 | £56,299 | £36,749 | 3,712 | 1,455 | £208.1m |
Land Rover
£137,800
£1,370,800
Land Rover
2024
£229,990
£249,990
Land Rover
2020
£35,460
£114,960
Land Rover
2015
£4,000,000
£15,450
Land Rover
2020
£383,500
£38,760

Land Rover
2023
£219,990
£77,990